Points
A classic point cloud is just a set of points.
In pyntcloud points is one of many attributes of the core class PyntCloud, although it’s probably the most important.
This attribute is internally represented as a pandas DataFrame.
It is highly recommended to read the pandas DataFrame documentation in order to understand the possibilities for manipulating the point cloud information that this entity offers.
from pyntcloud import PyntCloud

cloud = PyntCloud.from_file("test/data/filters/filters.ply")

cloud.points
     x    y    z
0  0.0  0.0  0.0
1  0.1  0.1  0.1
2  0.2  0.2  0.2
3  0.5  0.5  0.5
4  0.9  0.9  0.9
5  1.0  1.0  1.0
Restrictions
Two of the few restrictions that you will find in pyntcloud are related to the points attribute.
- points must be a pandas DataFrame
If you want to instantiate a PyntCloud using the constructor, you have to pass a pandas DataFrame as the points argument.
If you want to change the points argument, you have to change it for a new pandas DataFrame.
import numpy as np

from pyntcloud import PyntCloud

points = np.random.rand(1000, 3)

cloud = PyntCloud(points)
TypeError: Points argument must be a DataFrame
- points must have ‘x’, ‘y’ and ‘z’ columns
The DataFrame that you use as points must have at least this 3 columns.
import numpy as np

import pandas as pd

from pyntcloud import PyntCloud

points = pd.DataFrame(np.random.rand(1000, 3))

cloud = PyntCloud(points)
ValueError: Points must have x, y and z coordinates
Basic manipulation
As mentioned above, the fact of having the points information in a pandas DataFrame brings many possibilities regarding the analysis and manipulation of this data.
As you can read in Working with scalar fields, one of the key features of pyntcloud is the flexibility that it offers regarding how you can add information and manipulate points.
You can quickly get statistical information about points with a single command:
from pyntcloud import PyntCloud

cloud = PyntCloud.from_file("test/data/filters/filters.ply")

cloud.points.describe()
              x         y         z
count  6.000000  6.000000  6.000000
mean   0.450000  0.450000  0.450000
std    0.423084  0.423084  0.423084
min    0.000000  0.000000  0.000000
25%    0.125000  0.125000  0.125000
50%    0.350000  0.350000  0.350000
75%    0.800000  0.800000  0.800000
max    1.000000  1.000000  1.000000
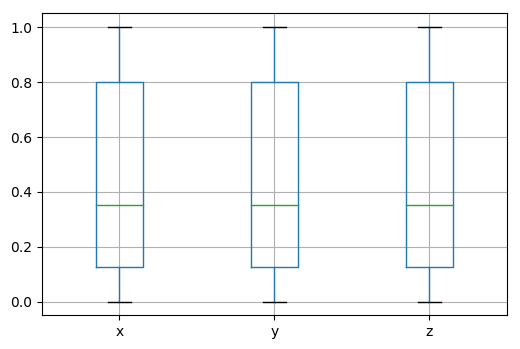
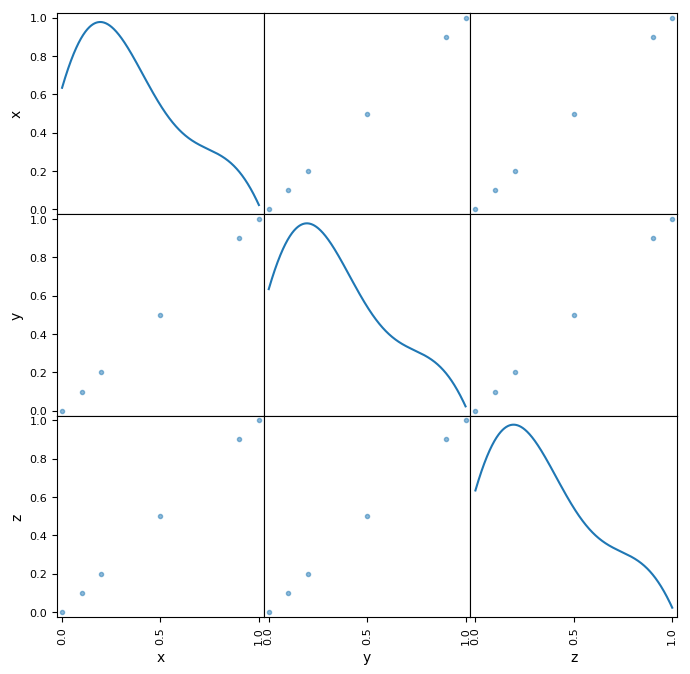
You can use different plots to visualize the information in points:
cloud.points.boxplot()
from pandas.tools.plotting import scatter_matrix

scatter_matrix(cloud.points, diagonal="kde", figsize=(8,8))
You can perform operations over points like getting which points are above some “z” coordinate:
above_03 = cloud.points["z"] > 0.3
above_03
0    False
1    False
2    False
3     True
4     True
5     True
Name: x, dtype: bool
You can find more information about this kind of operation in Working with scalar fields.
As mentioned above, to fully understand the manipulation possibilities that the pandas DataFrame brings, is better to take a look at its documentation.